Accurate Specification of a Signal Source,
Another major early concern.
Once again, signal sources were the first HP productions.
A signal source delivers a signal. A perfect control of its characteristics is of main interest.
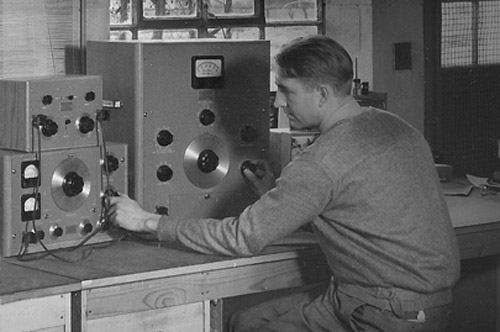
One of the most classic "Early 1940s, HP Garage Picture" shows Dave Packard testing a 205AG audio generator with a 300A wave analyzer. Sure the 300A was not yet a spectrum analyzer, but it was the very first HP commercial attempt to produce an instrument capable of analysing the various components contained in an electronic wave.
Such an original wave analyzer would lead to four different families of instruments. The telephone industry would drive the evolution of the original wave analyzer to a category called Selective Level Meter. Radar, TV and radio communication would generate a fast growing market for the widespread Spectrum Analyzer category. In the acoustic, mechanic and vibration measurements domain, more and more sophistication would be required first for, the Analog then the Digital Signal Analyzer. The fourth category was entirely dedicated to audio frequency distortion measurement, and was named Distortion Analyzer.
HP were involved in this technolgy from its origin and would follow the market needs in each of these categories providing the various industries with ever growing families of products.
HP launched into Spectrum Analyzer market in 1964. This market was owned by "Polarad" and "Panoramic Corp". Both company produced Analyzers which were mostly single-octave-band, hand-tunable receiver using klystrons as the first Local Oscillator. The second LO was the sweeping one, providing a 100 MC sweep-width in the best case. Art Fong, the project enginneer assigned to the HP analyzer, totally revolutionized this concept by assigning the sweeping function to the first LO. By designing a sweeping FIRST Local Oscillator, using a backward-wave-oscillator (BWO) for the source, it was possible to provide a remarkable 2000 MC of sweep width.
The HP 8551A was presented for the first time in the August, 1964 issue of the Hewlett Packard Journal, and in the 1965 catalog under the following subtitle: "A Totally New Concept in Microwave Spectrum Analysis". It would be the first of a five decade, permanently growing leadership, which is still today a leading product line of the Agilent Technologies company.
| Dave Packard using a 300A Wave Analyzer - Courtesy of the Hewlett Packard company |
 |
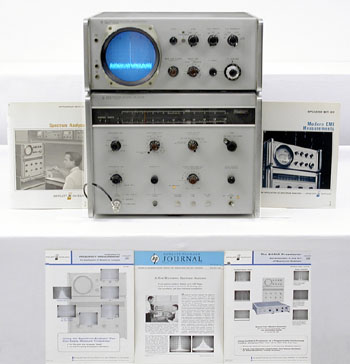 |
Still working, the 8551A of the HP Memory Project shown with some
of the many documents related to its concept and usage
|
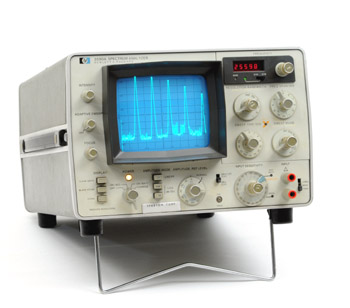
The First Calibrated
Spectrum Analyzer
The 851A/8551A Spectrum Analyzer covers the frequency range from 10 mc to 10 gc with direct single coaxial input and from 8.2 to 40 gc with external waveguide mixers and adapters.
Ten calibrated spectrum widths from 100 kc to 2 gc are available. This wide range of spectrum widths permits observation of widely separated signals and broad spectra, as well as detailled examination of individual signals, distortion products, etc.
Signal amplitude is controlled by a 0 to 60 db RF attenuator (10 db steps), plus a 0 to 80 db IF attenuator (1 db steps plus vernier) .
The calibrated, displayed dynamic range is 60 db.
The Application Note N°63, shown on the picture above gives many details on the design considerations of the 8551.
The PDF of the 1968 edition of the AN63 "Spectrum Analysis" is available here on the web site: Application Notes Listing
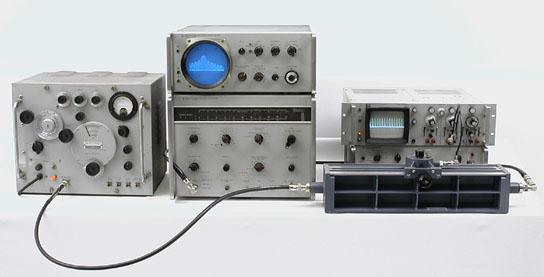
| The Collection 8551A working on a sixties pulse bench reconstruction |
 |
One more HP's "Invention of Opportunity"
The 8551A Spectrum Analyser is one of the most successful HP product chosen by Bill Hewlett for a special appreciation in the introduction of his book: "Inventions of Opportunity" edited in 1983:
" Spectrum analyzers had been around for some time when this article was written. Prior to the HP unit described, however, these instruments had some very practical problems and limitations. For example, results were often ambiguous due to harmonic and spurious signals. Further, they were not accurate with reference to frequency, and therefore required frequent calibration. Finally, they tended to be narrowband, and thus needed an array of plug-in tuners to cover the required bands of interest. A new approach was necessary, and the tools were at hand.
The solution was an improved backward-wave oscillator (BWO), with particular attention given to a "clean" signal. A local manufacturer designed a tube to our specifications. It covered the frequency range from 2 to 4 GHz, and was voltage tunable. Thus, with a low-noise 2 GHz IF amplifier, a direct frequency of 10 MHz to 4 GHz was obtainable with image frequencies now spaced 4 GHz apart, rather than the 0.4 GHz available from conventional design. By use of a 10 MHz quartz crystal oscillator, it was possible to obtain one percent accuracy in tuning and frequency sweep. It also was possible to achieve automatic bandwidth selection for optimum resolution as the sweep width and rate were changed. With a logarithmic display, a 60 dB dynamic range was obtainable.
For its time, the instrument revolutionized the field of spectrum analysis, and opened up many new areas of application."
 |
HP 141T Mainframe with 8552B IF and 8555A RF Plug-In
|
Next ten year reign
The next evolution of Art Fong's concept would produced one of the most popular HP's product lines of the seventies. The 140 series oscilloscope mainframes and 855X Spectrum Analyzer Plug-in series would be one of the most contributive to the HP brand image up until the birth of the HP35 pocket calculator.
The 855X series started in 1968 with the 8552A and 8553L twin plug-in and the 141S Display section. The set was introduced in the August, 1968 HP Journal as a "Fully Calibrated Frequency-Domain Measurement System...", "as easy to use and interpret as an oscilloscope." Its frequency range, 1 kHz to 110 MHz, is a span that includes audio, video, and IF amplifiers, navigational aids, telemetry, and most multiplex basebands, as well as commercial AM, FM, TV, and land mobile communications.
The next one, in the order of appearence was the 8554L RF plug-in introduced in the August, 1969 journal. It extended the frequency range to the upper limit of the UHF spectrum. The 0.5 to 1250 MHz coverage is obtained by using a YIG-tuned solid-state first local oscillator. This new technology permits for the first time to display the full spectrum from 0 to 1250 MHz in a single sweep, yet preserving the flatness, dynamic range and absolute amplitude calibration of the 110 MHz plug-in.
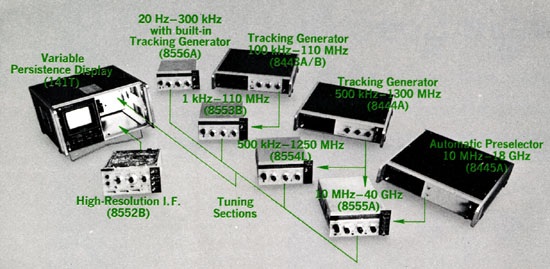
The next step, in September 1971, completed the family with a microwave tuning section covering 10 MHz to 18 GHz (8555A), a low frequency section covering 20 Hz to 300 kHz (8556A) and two Tracking Generators (8443A, 0.1 to 110 MHz) and (8444A, 0.5 to 1300 MHz).
The HP 140/855X Spectrum Analyzer Family in 1971
Photo from the Hewlett Packard Journal, September 1971, page 3 - Courtesy of the Hewlett Packard Company |
 |
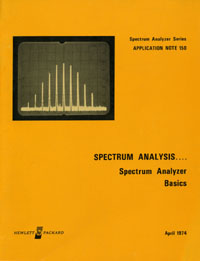 |
Cover of AN 150 - April,1974
Courtesy of the Hewlett-Packard Company
|
Spectrum Analysis... Customer Support
The AN150 Series was probably the most largely diffused set of application notes during the seventies, which, without question, contributed to HP's leadership in spectrum analysis measurement techniques.
The AN150 series recaps all the basic knowledge required to achieve the best measurements possible using the 1970 spectrum analyzers. Scans of our collection of original AN150 are available here:
PDF Files of Spectrum Analysis AN150 Series
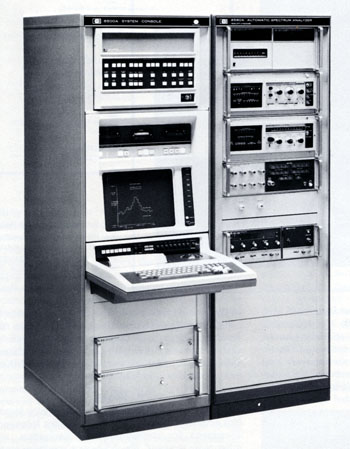 |
The HP Model 8580A, Automatic Spectrum Analyzer.
Many different configurations can be built.
This one is typical of those for use in automatic spectrum monitoring. |
Introducing the A.S.A.
(Automatic Spectrum Analyzer)
In 1972, the fast growing performance of the very young HP's first computer, associated to the second generation of HP synthesizer and to interfacable version of the 855X spectrum analyzer plug-in family, permited to propose the very first Automatic Spectrum Analyzer Systems.
They were not standard "catalog" products but rather different configuration built-up to answer specific market needs. The potential uses for the ASA fall naturally into two major classes. One can be called "Spectrum Monitoring"; it includes such end uses as site surveillance, system monitoring, electronic compatibility testing, and some aspects of electronic intelligence. The second class can be called "Stimulus / Response Testing"; it includes the variety of frequency domain tests often run on such components as amplifiers, mixers, modulators, multipliers, oscillators, and combinations of these such as receivers or transmitters.
These very expensive ASA systems had obviously a limited market in the beginning, but the important news is that every constituting elements, including the computer, interfaces, and associated software were "homemade" HP products. This multiple, internal know-how would give HP considerable advantages for further evolution of the ASA systems. The next coming drastic evolution in components integration and digital processing would permit to develop the next revolution: the 8566, Automatic Microwave Spectrum Analyzer, before the end of the 1970's.
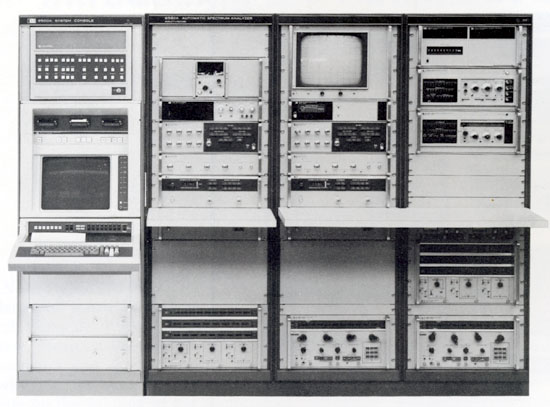
The HP Model 8580A, Automatic Spectrum Analyzer.
Another configuration dedicated to Stimulus / Response testing of nonlinear components
Photo from the Hewlett Packard Journal, February 1972, page 4 - Courtesy of the Hewlett Packard Company |
 |
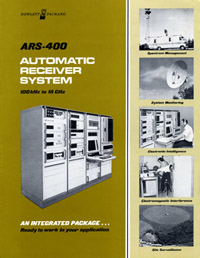 |
Cover of the ARS-400 datasheet
Courtesy of the Hewlett-Packard Company
|
ARS-400 Automatic Receiver System
The permanent evolution with new technolgies integration of the Model 8580 described above, finally gave birth in 1975, to a complete integrated package, the ARS-400 Automatic Receiver System.
The commercial document, downloadable here, gives an in-depth description of the measurement capabilities of the ARS-400 Automatic Receiver System.
PDF File of the ARS-400 Datasheet (3.4 Mb)
Lower Frequency, Lower Cost, but Already Automatic
The above presented first generation of Automatic Spectrum Analyzer was only accessible to the largest industries, administrations, and military markets. But as soon as 1975, lower cost, audio and radio frequency ASA became accessible to small and medium size companies.
Different facts contributed to these developments. The fast performance increase of the second generation of HP's Desktop calculators (9810/20/30 born in 1972-73) was the first. Probably the most important was the introduction of a new system to interface these calculators with instruments. This system was standardized under the reference "IEEE 488". The contribution of HP to this standard was such that it was nicknamed "the Hewlett Packard Interface Bus" (HP-IB). Its performance and ease of use was such that it is still in use today ! A new generation of "HP-IB, Programmable" instruments began to grow in every HP's product lines.
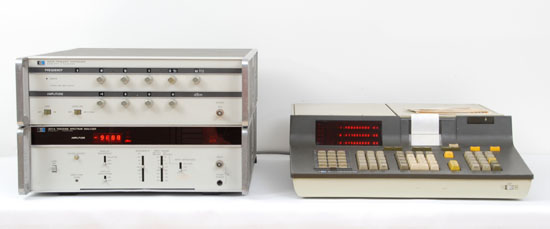
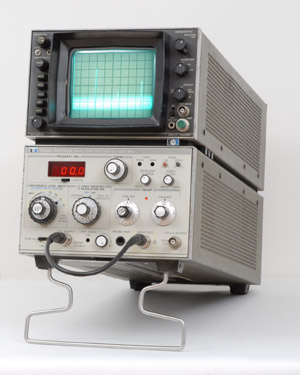
In the spectrum analyzer category, the 3571A, shown below was the first. It was a 10 Hz to 13 MHz Tracking Spectrum Analyzer using an external programmable Synthesizer as the first local oscillator signal source. The 3320B synthesizer was the cheapest solution, and the 3330A/B gave improved accuracy and faster measurement speed. Different packaged calculator-based systems that included the analyzer and a synthesizer was known as the Model 3044A and 3045A Automatic Spectrum Analyzer and was introduced in the 1976 catalog.
In spite of their limitation to the lower part of the frequency spectrum, these configurations opened the spectrum analysis measurements to a new dimension of accuracy with the use of synthesized local oscillator, and a new dimension of data manipulation and expended range of displayed results with the use of controling computers.
| The Collection 3571A (lower left) and 3320B Synthesizer (upper left) - 9810 Controler on the right |
 |
Next extensions to the Analog Part of the Product Line
All trough the 70s, the spectrum analyzer product line continued to grow offering as many answers as possible to the various markets needs and customer problems.
Progressive integration of digital circuitry added new facilities to the spectrum analyzer, for a gain in ease of use and accuracy of measurement. One example is the LED-diode technology evolution which brought
digital readout of measured parameters to most analyzers during the 70s. A short selection of some popular analog spectrum analyzers developed during this period follow.
 |
HP 3580A Low Frequency Spectrum Analyzer
|
1973 - HP 3580A
The Model 3580A is a spectrum analyzer optimized for frequencies between 5Hz and 50kHz.
The major contribution of this instrument is digital storage of the display information. The display is refreshed at high speed on a conventional CRT from a digital memory. This eliminates the analog storage and slow sweep rates that have been a problem for even the best CRTs.
A second contribution is the reduction of sweep time through the use of a technique called "adaptive sweep". This technique takes advantage of the fact that the spectrum of interest is usually above a noise or threshold level. When the signal is below the selected threshold it is possible to speed up the sweep. When signals are encountered that are above the threshold, the sweep slows down to reproduce the full response. It is possible to achieve as much as an order of magnitude improvement in sweep speed with this feature.
A third contribution is a resolution bandwidth of 1 Hz, the best available on any sweeping spectrum analyzer. This allows the resolution of closely spaced spectral components. It also simplifies noise analysis where readings are traditionally referred to a bandwidth of 1 Hz.
The combination of these features plus others result in an instrument uniquely optimized for low frequency spectrum analysis.
 |
HP 181T Mainframe
with 8558B Spectrum Analyzer Drawer
|
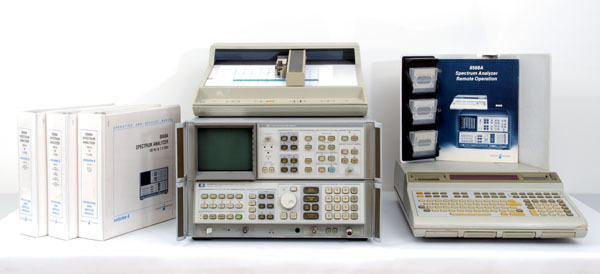
1975 - HP 8558B
The HP 8558B Spectrum Analyzer is a fully calibrated spectrum analyzer designed for simple operation. It is a plug-in which fits into any HP 180 Series oscilloscope mainframe.
The analyzer has a frequency range from 100 kHz to 1500 MHz and a digital LED readout for more accurate frequency measurements. Absolute Amplitude calibration and a large screen display' enable accurate voltage and power measurements to be made.
Through the use of coupled controls, the instrument can be made to operate using only three knobs. Simple three-knob operation means the inexperienced user needs very little training.
Reduced cost and portability opened the 8558B to a very large diffusion as a bench and on site service instrument, mainly in the telecommunication and CATV applications.
 |
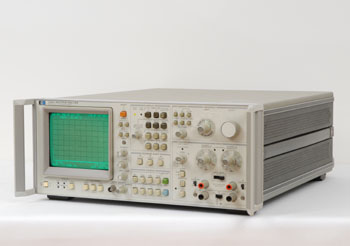
HP 8565A Microwave Spectrum Analyzer
|
1978 - HP 8565A
The 8565A which covered from 10 MHz to 22 GHz (40 GHz with external mixer), had built-in YIG filter preselection. The analyzer could display .01 to 22 GHz in just two spans for rapid location of signals prior to close-in analysis in one of six microwave bands.
Fully automatic stabilization in narrow spans reduced residual FM and drift. Standard resolution bandwidths range from 1 kHz to 3 MHz. Option 100, provided additional 100 Hz and 300 Hz IF bandwidth filters.
The cathode ray tube, bezel LED's displayed all pertinent control settings needed for signal evaluation in one central location. This data is also captured in CRT photos. Two years later an updated version of this analyzer, the 8569B would add to the 8565 performance, full HP-IB programmability and would replace the analog variable persistance CRT by a digital storage display.
Processor Aboard, the Digital Revolution
THE MAGNITUDE OF IMPROVEMENT in performance over older instrumentation provided by microprocessor-controlled instruments had been such that these new instruments clearly represented a new generation. The microprocessor's contribution to improved performance is not only in the obvious area of more comprehensive data analysis but to a greater extent in providing a level of control that allows the implementation of more complex and powerful measuring hardware.
 |
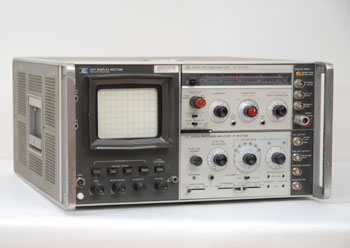
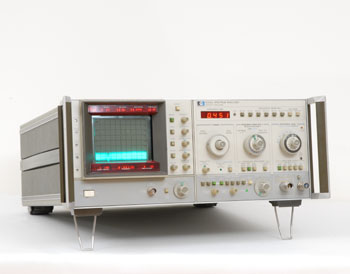
HP 8568B Automatic Spectrum Analyzer
|
1978 - HP 8568A
Thus, with microprocessors controlling its operation, the new Hewlett-Packard Model 8568A Spectrum Analyzer, achieved a significant improvement in signal-analysis capability over previous analyzers.
With a measurement range of 100 Hz to 1500 MHz, and such features as synthesizer-controlled tuning, resolution bandwidths as fine as 10 Hz over the full tuning range, 90-dB log display, excellent spectral purity, and digital storage with display annotation, it made a major contribution to the field of spectrum measurement.
These features rely heavily upon the internal digital processors, which also give the analyzer unparalleled ease of operation and full HP Interface Bus compatibility. Bus compatibility makes the power of spectrum analysis measurements practical and cost effective in production line applications as well as in unattended spectrum surveillance and similar applications.
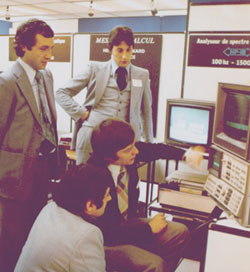 |
Demonstrating the HP 8568A Spectrum Analyzer
Paris U.S. Trade Center - February 1978 |
8568A Introduction,
A Curator, personal note
During the 1970s, France's most important exhibition of electronic equipment was the "Salon des Composants Electronique" which took place in Paris every year at springtime. I had just joined HP France at the end of 1977, the 1978 vintage of this exhibition introduced the 8568A spectrum analyzer.
The demonstration of this instrument was so spectacular that it generated public reaction similar to that produced by close-up card tricks. The spectators could hardly believe what they were seeing.
The short form demo was about 15 minutes long and I produced about 100 demos during the first three days of the exhibition. Turning voiceless at the end of the last morning, I sadly handed over my place to another field engineer who produced the afternoon demos, only to find even greater pleasure, looking at the faces around me.
Even the most blasé of them couldn't retain their smiles of surprise when discovering the power of functionalities never before seen such as -Marker Peak Search - Marker Center Freq - Zoom. Nobody who worked daily with analog spectrum analyzers of the time could expect that this new instrument would bring such a leap forward. Their surprise would not stop there. One year later HP introduced the 8566A with exactly the same performances, widdening up to 22 GHz in the microwave spectrum .
| HP 8568A Automatic Spectrum Analyzer complete configuration of the ending 70s |
 |
Signal Analyzer, Selective Level Meter,
Two other Members of the Family
As previously stated in the introduction of this chapter, the very first wave analyzer production would lead to four different families of instruments. The Spectrum Analyzer family, just described, was by far the most popular. The three others, the Signal Analyzer, the Selective Level Meter, and the Distortion Analyzer were not so popular even if they were important to solve specific industry problems.
The purpose of this "Quick Tour" is to list the products which are the most significant to the HP product line history. By the way we will not reserve a large space to these three families inside the "Quick Tour". More information will be developed later in the Technology chapters. However, two instruments in the Signal Analysis category are of importance. The first is the 5420A Digital Signal Analyzer which was the most sophisticated instrument in its category by the end of the 70s. The second is the 3582A which was the first "Real Time" Spectrum Analyzer integrating an advanced microcomputer to execute the Fast Fourier Transform (FFT) to perform equivalent measurements as much as one to two orders of magnitude faster than a swept analyzer.
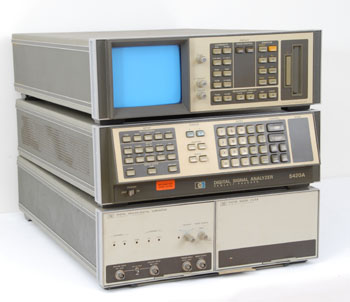 |
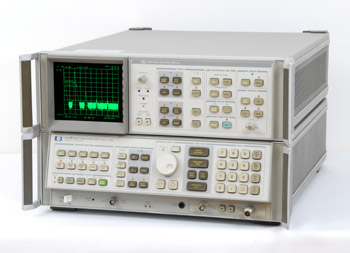
HP 5420A Digital Signal Analyzer
|
1977 - HP 5420A
The Hewlett-Packard 5420A is a dual-channel, all digital instrument capable of providing time and frequency domain analysis of complex analog signals in the range of dc to 25 kHz. Complete calibration, fully annotated display, and powerful post-processing capabilities are all standard in the 5420A.
We will not try to list the technical specifications of the 5420A. The smalest data-sheet describing the HP 5420A is a ten pages document. But the 5420 is a good example to be listed to show the ability of HP to adapt to the most specific market needs. The customers targeted by the Digital Signal Analyzer was so different from the usual electronic industry HP customers, and the technical problems to be solved so unknown to the general instrument field engineer, that a specific division and sales force were created for the marketing of this product.
The "DSA - Laser" division was created during the seventies to develop, manufacture and sell products finding application in the mechanic and machinery industry. The Laser Measurement System for dimensional metrology associated with the DSA product line would evoluate during the next decade to a highly succesful division answering industry problems as various as those listed below in a 1977 data-sheet:
* Vibration analysis of steam turbine blades and other components to determine failure producing mechanisms. * Online monitoring of nuclear core movements in a pressurized water reactor. * Study of noise and vibration problems in vehicles. * Modal analysis of automotive components. * Teaching and research in vibration and signal analysis at major universities. * Vibration, noise, and dynamic stress analysis of heavy equipment. * Vibration analysis and testing of spacecraft. * Analysis of vibration data from aircraft wind tunnel flutter models. * Closed loop servo control system analysis of disc drive units. * Analysis of brain waves and other body functions under stress. * Noise and vibration reduction on consumer chain saws. * Loudspeaker design and testing. * Vibration studies on helicopters to reduce noise inside the craft. * Vibration analysis of machine tools to improve chatter resistance. * Dynamic analysis of models of dams, bridges, buildings, etc., to study earthquake resistance. * Monitoring of critical rotating machinery to avoid catastrophic failures. * Identification of sources of noise and vibration in automobiles.
 |
HP 3582A, Dual-Channel, Real Time, Spectrum Analyzer
|
1979 - HP 3582A
On the border between Signal and Spectrum Analyzers, the HP 3582A is a dual-channel, real-time analyzer integrating transfer function measurements in the 0.02 Hz to 25.5 kHz spectrum. It was the first instrument offering the functionalities of a real time spectrum analyzer, thanks to its Fast Fourier Transform microcomputer, and those of a network analyzer, and to its dual independant input channels.
Selective Level Meter,
Just for information, below are three members of the Selective Voltmeter family produced during the 1960 - 1980 period. The full HP's Selective Voltmeters production will be described in the last 1980 - 2000 period of this Quick Tour.
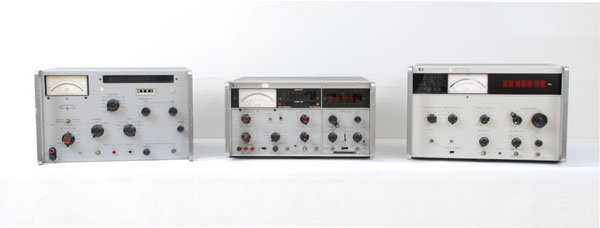
| HP 310A (1963) - HP 3590A (1969) - HP 312B (1976) |
 |
Distortion Analyzer,
Audio frequency distortion measurement was a very early concern at HP, from the days when Bill Hewlett himself was designing audio products. One consequence of the first HP products, which were mostly audio oscillators operating in the low frequency range, was that the designers needed a tool to quantify their signal distortion. As soon as 1945, a vacuum tube distortion meter, the HP 330B was introduced for solving most problems of signal distortion measurement.
Twenty years later, in 1965, it was time to update the distortion meter product line with fully transistorized instruments. A complete family of four new instruments was introduced, and described in the April 1966 issue of the Hewlett Packard Journal. The four new analyzers all use the same measuring circuitry with wide filter tuning range, from 5 Hz to 600 kHz, and broad voltmeter frequency range, up to 3 MHz.
In this new family, for applications where lower initial cost was more important than speed and convenience of automatic nulling, Models 331A and 332A, had precision mechanical drives for accurate manual tuning without automatic nulling. For a little higher price, both Models HP 333A, and HP 334A, included an automatic nulling circuitry.
Even after the introduction of the 339A in 1978, most of the models of the HP 33X family would stay available in the general catalog until the beginning of the 1980s... Another 20-year lifetime family in the Hewlett Packard production.
Still an analog instrument, the HP 339A introduced in 1978, featured more advances in its technical specifications. The Model 339A Distortion Measurement Set is an ultra low distortion measuring system, complete with Total Harmonic Distortion (THD) Analyzer, true-rms voltmeter, and built-in, ultra low distortion tracking sine-wave oscillator. The instrument allows THD distortion measurement as low as 0.0018% over a 10 Hz to 110 kHz frequency band including harmonics to 330 kHz.
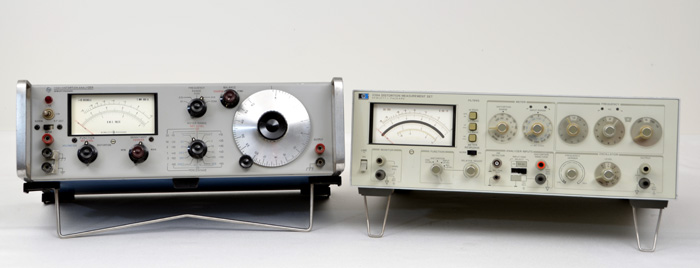 |
| The HP 332A (introduced in 1965) on the left, and its 1978 successor, the HP 339A on the right |